Technical
Decking manufacturers reach the standard
SCI Senior Engineer Andy Smith explains how decking manufacturers ensure their products comply with the relevant standard.
Characteristic resistances from product tests
Composite floor decking manufacturers typically disseminate information on the performance of their products through load-span tables on datasheets or through bespoke software. What isn’t clear from the published data is the testing and analysis that has gone into defining the spanning capabilities of their products. This article gives an overview of how decking manufacturers ensure that the design of their products comply with the relevant Standard. Although focused on composite floor decks, the analysis methods are applicable to a wide range of products and tests.
Testing vs. calculation
For design to both the British Standards and the Eurocodes, the resistances and second moments of area of the decking profiles can be calculated from a series of equations that take into account the buckling of each of the compression elements. However, most decking profiles have a number of stiffeners and embossments, meaning that the predictions can be inaccurate. Instead of relying on these predictions, the manufacturers undertake testing on their rolled products to determine their performance.
Types of test
In most cases, the test types and layouts are specified by the relevant Standards. For composite decking profiles tests are conducted at the construction and normal stage. Most manufacturers also undertake fire testing to develop explicit design data for their products rather than using the rather conservative rules available in the Standards.
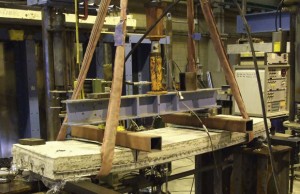
At the construction stage four types of test are conducted: single-span sagging tests; single-span hogging tests; two-span continuous tests; and web-crushing tests. The combined results of these tests provide sufficient information to define both the load carrying capability and the serviceability performance of the profile when used in either a single-span or continuous-spanning configuration. The test details are given in BS EN 1993-1-3, Annex A.
At the normal stage the bond between the steel profile and the concrete, commonly presented in terms of the m and k values, needs to be established. This is done by casting composite slab specimens and testing them over a single span until failure of the bond occurs. Tests are undertaken at two spans so that the effect of friction (which depends only on the force applied) can be separated from the effects of mechanical interlock (which depends on the shear span – the distance between the support and the applied load). Some of the specimens are also subjected to cyclic loading prior to ultimate failure to break down any chemical bond and to artificially age the slabs.
Characteristic and design values
The results from a single test are not sufficient to properly define the performance of the decking product – an abnormal error in the manufacture of the product or the setup of the test could result in an unrepresentatively high or low result. Therefore groups of at least three, and generally four, nominally identical tests are performed (i.e. there is no difference between the tests except a different test specimen is used). This enables significant differences between results to be identified (highlighting errors in manufacture or test procedure), and also gives an indication of the variability of the property under consideration. It is the knowledge of this variability that enables a characteristic value to be established.
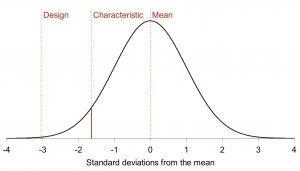
A characteristic resistance represents a confidence of 95%, i.e. in 95% of cases the resistance of the product should be above the characteristic resistance. Comparatively the design resistance, which is generally obtained by dividing the characteristic resistance by a partial safety factor (a gamma value), should represent a confidence of 99.88%.
The partial safety factors are defined in the Standards or National Annexes, and take account of the variability of the entire population. For example the partial factor for steel strength (γM0 = 1.0 in the UK) reflects that steel strength is consistently higher than the specified nominal value, whereas the partial factor for concrete (γC = 1.5 in the UK) reflects the high variability of that material.
For a large number of tests on a product, it would be usual to find that the results were normally distributed (the familiar ‘bell curve’ distribution). From the test results the mean and standard deviation can be determined. If the tests cover all of the possible variability of the product (for example, a representative range of steel strength and thickness for the bare steel properties), the characteristic resistance of the product would be determined by subtracting 1.64 standard deviations from the mean, as shown. However, tests are generally conducted with a single set of properties and in small groups, so alternative methods of determining characteristic resistances are required.
Determining a single property
In some cases, standard test set ups allow for a simple analysis to be conducted, subject to the variability of the test results being within reasonable limits. This analysis is specified by the Standard, and based on prior knowledge of a number of similar tests. An example of this is the bond between the steel deck and the concrete of a composite slab when analysed to BS EN 1994-1-1. For this case two sets of tests are undertaken at different spans and a characteristic design relationship is established by taking 90% of the minimum value at each span, and determining the m and k values from those modified results. This will only apply when certain limits on the concrete strength, steel strength and steel thickness are met, and can only be used when the variability of the test results is suitably small.
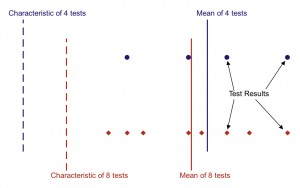
Mean and characteristic of two sets of test results
A more general analysis uses the mean and standard deviation of the test results to determine a characteristic resistance. For the analysis of the bending or crushing resistance of a profile to BS EN 1993 1 3, the test results are first normalised by applying a modification factor that compares the measured yield strength and thickness to the nominal values, and uses an assumed relationship to correct the results.
For tests where the thickness or yield is below the nominal value, a more conservative assumption is taken in the adjustment. This modification allows the tests to be performed on a single batch of the product, and the characteristic resistance will rely on the normal production controls of the steel coil to ensure that it is representative.
Once the mean and standard deviation of the adjusted test results have been calculated, the characteristic resistance is determined by subtracting a number of standard deviations, k, from the mean. The selection of k is based on the number of tests that were performed, since this impacts on the confidence in the calculated mean value. This is illustrated in the figure on the right – the mean of the set of eight tests is lower than the mean of the set of four, which implies that the set of four tests is overestimating the actual mean value. As there is less confidence in the test mean, the characteristic value from the set of four tests is lower than for the set of eight tests, despite the two sets having a similar standard deviation. As stated above, for a large set of test results k = 1.64, but in this case k = 2.63 and k = 2.00 have been used for the set of four and eight respectively, showing the assumed variability of the smaller sets.
Calibrating a design equation
In more complex cases, such as when test results are used to calibrate a design equation, the sensitivity of the test results with respect to the material and dimensional inputs needs to be established. This method (outlined in BS EN 1990) takes into account the effect of variables that are not included within the test sets. For example, if the tests are conducted at a single steel strength, this method would allow an equation to be calibrated that enables characteristic values to be calculated for a range of steel strengths. Rather than normalising the test results based on the material properties, a design equation that relates the material properties to the resistance is used, subject to it being shown to be appropriate. The effect of small variations in the input properties on the resistance can be established from the equation, and by considering the likely standard deviation of the input properties, the standard deviation of the resistance can be estimated. From this and the test results, the equation can be calibrated to give characteristic values in a similar way to described above, though because the variations are more explicitly considered, the k values are generally lower.
Calibrating a design equation
IConfidence in the quality of the products and the accuracy of the manufacturer’s data can be endorsed by schemes such as CE Marking and SCI Assessed. Under the SCI Assessed scheme, a review is undertaken of the test data and the analysis method employed to check that the characteristic resistances have been correctly calculated to the relevant Standard. CE Marking offers a broader confidence in the accuracy of the manufacturer’s technical claims regarding the product. It is likely that CE Marking will become compulsory in 2012. In any event, properly defined design values using high quality test results and good production control will ensure that the products are capable of achieving their stated design capabilities in practice and will minimise the risks to specifiers and manufacturers of poor performance.


