Fatigue
Introduction to fatigue
design to BS EN 1993-1-9
The assessment of fatigue performance is routine in bridge design but is only relevant to specific
elements in buildings which may suffer from fatigue damage. One example of these is crane
runway beams. Richard Henderson of the SCI introduces some of the background.
Introduction
The phenomenon of metal fatigue involves the development of cracks in
elements that are subject to many repeated applications of loads which are
lower than the maximum loads to which the element is subjected. If fatigue
cracks develop unnoticed, they will eventually result in complete failure of the
element with potentially catastrophic consequences.
History
Research into fatigue in metal structures began as early as 1837 with tests on
conveyor chains. A locomotive axle failure due to fatigue was recognized as
the cause of a train accident at Meudon, near Versailles in 1842. F Braithwaite
coined the term fatigue in his report “On the fatigue and consequent fracture
of metals” published in the ICE minutes of proceedings in 1854. August Wohler
conducted systematic investigations into metal fatigue of railway axles over a
20 year period from 1852, produced S-N curves illustrating fatigue behaviour
and introduced the idea of an endurance limit. In 1945, A M Miner developed
a design tool based on the Palmgren linear damage hypothesis. The stress
raising effect of small-radius corners and the consequent effect on fatigue
behaviour was established following investigation into the Comet air disasters
of 1953 and 1954.
350
300
250
200
150
100
50
0
1 10 100 1000 10000 100000 1000000 10000000
Basic Concepts
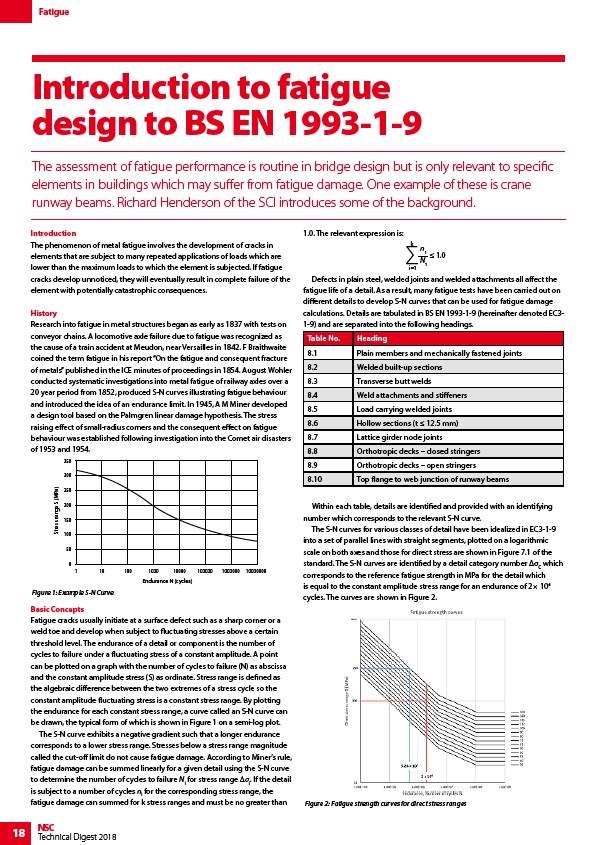
Fatigue cracks usually initiate at a surface defect such as a sharp corner or a
weld toe and develop when subject to fluctuating stresses above a certain
threshold level. The endurance of a detail or component is the number of
cycles to failure under a fluctuating stress of a constant amplitude. A point
can be plotted on a graph with the number of cycles to failure (N) as abscissa
and the constant amplitude stress (S) as ordinate. Stress range is defined as
the algebraic difference between the two extremes of a stress cycle so the
constant amplitude fluctuating stress is a constant stress range. By plotting
the endurance for each constant stress range, a curve called an S-N curve can
be drawn, the typical form of which is shown in Figure 1 on a semi-log plot.
The S-N curve exhibits a negative gradient such that a longer endurance
corresponds to a lower stress range. Stresses below a stress range magnitude
called the cut-off limit do not cause fatigue damage. According to Miner’s rule,
fatigue damage can be summed linearly for a given detail using the S-N curve
to determine the number of cycles to failure Ni for stress range Δσi. If the detail
is subject to a number of cycles ni for the corresponding stress range, the
fatigue damage can summed for k stress ranges and must be no greater than
18 NSC
Technical Digest 2018
1.0. The relevant expression is:
k
Defects in plain steel, welded joints and welded attachments all affect the
fatigue life of a detail. As a result, many fatigue tests have been carried out on
different details to develop S-N curves that can be used for fatigue damage
calculations. Details are tabulated in BS EN 1993-1-9 (hereinafter denoted EC3-
1-9) and are separated into the following headings.
Table No. Heading
8.1 Plain members and mechanically fastened joints
8.2 Welded built-up sections
8.3 Transverse butt welds
8.4 Weld attachments and stiffeners
8.5 Load carrying welded joints
8.6 Hollow sections (t ≤ 12.5 mm)
8.7 Lattice girder node joints
8.8 Orthotropic decks – closed stringers
8.9 Orthotropic decks – open stringers
8.10 Top flange to web junction of runway beams
Within each table, details are identified and provided with an identifying
number which corresponds to the relevant S-N curve.
The S-N curves for various classes of detail have been idealized in EC3-1-9
into a set of parallel lines with straight segments, plotted on a logarithmic
scale on both axes and those for direct stress are shown in Figure 7.1 of the
standard. The S-N curves are identified by a detail category number ΔσC which
corresponds to the reference fatigue strength in MPa for the detail which
is equal to the constant amplitude stress range for an endurance of 2 × 10⁶
cycles. The curves are shown in Figure 2.
Figure 1: Example S-N Curve
Endurance N (cycles)
Stress range S (MPa)
1.0
n1
N1 i=1
Figure 2: Fatigue strength curves for direct stress ranges