Technical
AD 493: Steel grade based on tested samples
The SCI has recently received a number of questions relating to the sampling of existing steelwork to determine the steel grade. In each case, no records of the steelwork exist, so samples have been obtained and tested. For understandable reasons, only a limited number of samples have been obtained, taken from different steel members within the structure. The testing has determined the yield strength and ultimate strength of each sample. The purpose of this Note is to remind engineers that the steel grade designation is related to the characteristic yield strength – which is significantly lower than the average yield strength
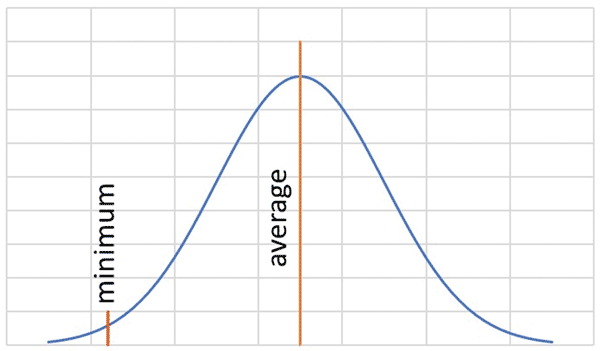
If a large number of samples in one steel grade were obtained and measured, the results would be expected to follow a normal curve as shown in Figure 1.
The minimum yield strength (for example 355 N/mm²) for S355 steel grade is at the extreme left of the distribution. Note that there is always a very small probability that a result might be less than the specified minimum.
If samples of existing steelwork are taken, it should be expected from Figure 1 that generally the tested strengths should be higher (and sometimes much higher) than the specified minimum for any particular grade.
Engineers are directed to Appendix C of SCI publication P427, which gives the minimum and mean values for test results which may be used to identify the likely steel grade. As an example, if the anticipated steel grade is S355, then according to Table C.1, the minimum and average yield strength of the tested samples should exceed 391 N/mm² and 426 N/mm² respectively.
In a small population of tested results, it is not sufficient to determine the steel grade simply based on all samples exceeding the specified minimum strength for that steel grade. Unless the average of the test results is significantly higher than the specified minimum, as demanded in P427, the form of the normal curve implies a high probability that other samples will be lower than the specified minimum.
Section C.3.3 of P427 covers a more comprehensive testing regime of members within the same group (same serial size, same function and detailing, as described in section 6.1 of P427). If this more extensive testing is undertaken, the calculated characteristic strengths should be compared to the minimum yield strength and ultimate strength tabulated in the appropriate material standards.
P427 is appropriate for steel used after 1970. The strength values tabulated in P427 are taken from Annex E of the proposed revisions to EN 1993-1-1.
Contact: David Brown
Tel: 01344 636555
Email: advisory@steel-sci.com


