Technical
Figure 3: Tee dimensions
40 NSC
October 18
The equations are quadratic curves fitted to data obtained
from a combination of physical test results and finite element
(FE) results calibrated against these tests. The temperature
profile within the width of the rib (i.e. over the full slab depth)
is described by two curves. The first curve applies over the first
80mm above the deck soffit and the second applies to the
remainder of the slab depth. Over the reduced depth of the slab,
the profile is described by a third curve.
The coefficients of each of these quadratics are tabulated for
fire resistance periods of 30, 60, 90 and 120 minutes, with some
of these values dependent on parameters determined by the
profile height, slab depth or trough width. These equations lead
to temperature distributions through the slab of the general
form illustrated in Figure 2. Different coefficients are presented
depending on whether the deck is re-entrant or trapezoidal.
The slab can be divided into a number of thin horizontal strips
whose temperatures can then be determined using the equations
discussed previously. The temperature of any mesh reinforcement
can be determined from the temperature of the concrete
strip at the level of the mesh. Separate equations are given for
determining the temperature of bar reinforcement.
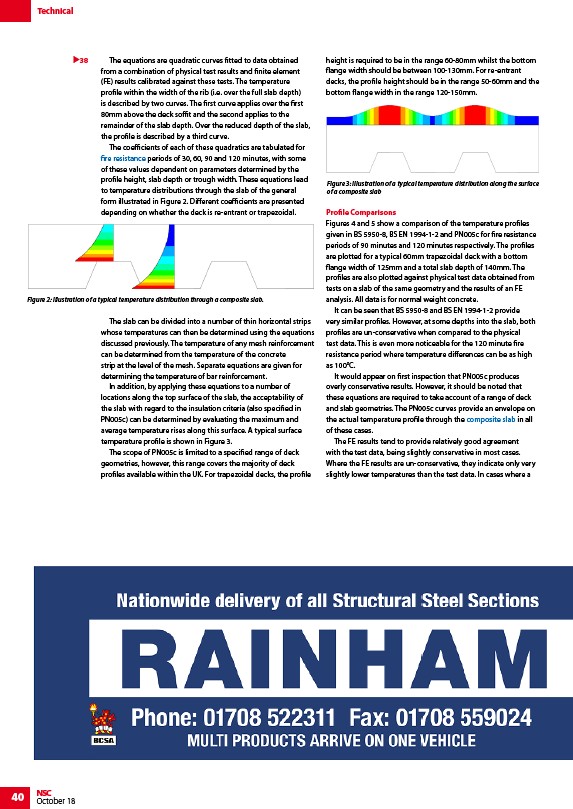
In addition, by applying these equations to a number of
locations along the top surface of the slab, the acceptability of
the slab with regard to the insulation criteria (also specified in
PN005c) can be determined by evaluating the maximum and
average temperature rises along this surface. A typical surface
temperature profile is shown in Figure 3.
The scope of PN005c is limited to a specified range of deck
geometries, however, this range covers the majority of deck
profiles available within the UK. For trapezoidal decks, the profile
height is required to be in the range 60-80mm whilst the bottom
flange width should be between 100-130mm. For re-entrant
decks, the profile height should be in the range 50-60mm and the
bottom flange width in the range 120-150mm.
Profile Comparisons
Figures 4 and 5 show a comparison of the temperature profiles
given in BS 5950-8, BS EN 1994-1-2 and PN005c for fire resistance
periods of 90 minutes and 120 minutes respectively. The profiles
are plotted for a typical 60mm trapezoidal deck with a bottom
flange width of 125mm and a total slab depth of 140mm. The
profiles are also plotted against physical test data obtained from
tests on a slab of the same geometry and the results of an FE
analysis. All data is for normal weight concrete.
It can be seen that BS 5950-8 and BS EN 1994-1-2 provide
very similar profiles. However, at some depths into the slab, both
profiles are un-conservative when compared to the physical
test data. This is even more noticeable for the 120 minute fire
resistance period where temperature differences can be as high
as 100°C.
It would appear on first inspection that PN005c produces
overly conservative results. However, it should be noted that
these equations are required to take account of a range of deck
and slab geometries. The PN005c curves provide an envelope on
the actual temperature profile through the composite slab in all
of these cases.
The FE results tend to provide relatively good agreement
with the test data, being slightly conservative in most cases.
Where the FE results are un-conservative, they indicate only very
slightly lower temperatures than the test data. In cases where a
38
Figure 2: Illustration of a typical temperature distribution through a composite slab.
Figure 3: Illustration of a typical temperature distribution along the surface
of a composite slab
/Structural_fire_resistance_requirements
/Floor_systems#Composite_slabs