Technical
Quality class Reduction of area in %
Z15 15 10
Z25 25 15
Z35 35 25
Table 1: Z Quality class
24 NSC
February 19
of area when the sample fractures is given by:
S– So u
× 100
So
where So is the original cross sectional area,
Su is the minimum cross sectional area after fracture.
Both the average and individual results are needed to define the
quality class in accordance with Table 1.
Minimum average value of three tests Minimum individual value
Eurocode requirements
A procedure to determine if improved through thickness
properties are required is given in Section 3 of BS EN 1993-1-10.
Readers should note that there is little enthusiasm in the UK for
this procedure, and alternative guidance is given in PD 6695-1-10.
Despite the UK position, the guidance in BS EN 1993-1-10
establishes important principles, reinforced by the PD. The
Eurocode notes that:
• The strain through the thickness of the material arises as welds
to the surface (see Figure 1) cool and shrink. If that shrinkage is
restrained by other stiff parts of the assembly, it is clear that the
possibility of lamellar tearing increases,
• Larger welds increase the possibility of tearing,
• Thoughtful weld detailing can reduce the risk, for example by
avoiding fusion faces which are parallel to the surface of the
steel,
• The sulphur content in the steel is important – lower levels
improve the through thickness properties of the steel.
The procedure in BS EN 1993-1-10 is essentially a scoring system
based on a number of contributing factors. Criteria that increase
the risk are awarded a higher score, those that reduce the risk
given a lower or negative score. The required Z quality class (Table
1) must be greater than the summation of the individual scores.
Some examples illustrate the features of the system:
A fillet weld throat 5 mm scores zero, a throat of 14 mm scores 6.
The table includes fillet welds up to a 35 mm throat with a score of
15, but would be unusual, one hopes!
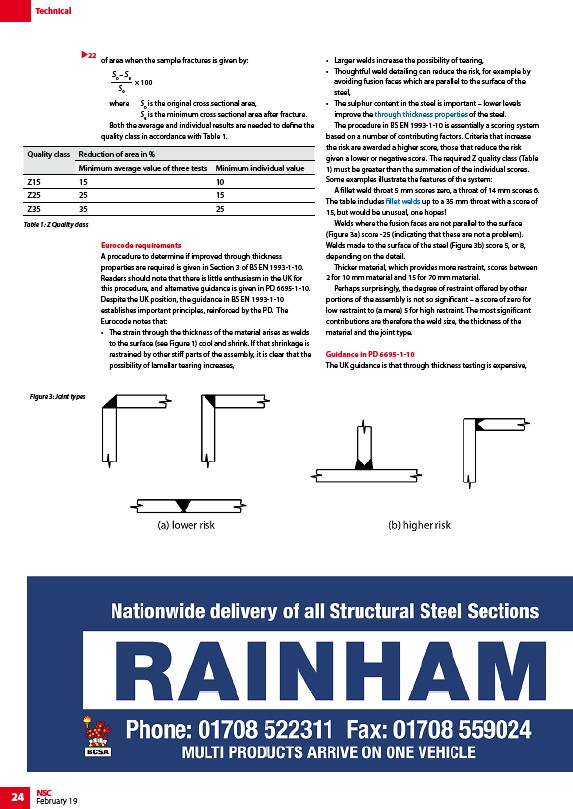
Welds where the fusion faces are not parallel to the surface
(Figure 3a) score -25 (indicating that these are not a problem).
Welds made to the surface of the steel (Figure 3b) score 5, or 8,
depending on the detail.
Thicker material, which provides more restraint, scores between
2 for 10 mm material and 15 for 70 mm material.
Perhaps surprisingly, the degree of restraint offered by other
portions of the assembly is not so significant – a score of zero for
low restraint to (a mere) 5 for high restraint. The most significant
contributions are therefore the weld size, the thickness of the
material and the joint type.
Guidance in PD 6695-1-10
The UK guidance is that through thickness testing is expensive,
22
Figure 3: Joint types
/Material_selection_and_product_specification#Through_thickness_properties
/Welding#Fillet_welds