Fatigue
NSC 19
Technical Digest 2018
The equation for the sloping part of the curves is of the form:
ΔσR
mNR = ΔσC
m2 × 106
with m = 3 for N ≤ 5 × 10⁶ and:
ΔσR
mNR = ΔσC
m5 × 106
with m = 5 for 5 × 10⁶ ≤ N ≤ 108.
The first equation can be expressed as:
3 × log10ΔσR + log10NR = 3 × log10ΔσC + log102 × 106
This is a straight line on a log-log plot with gradient -1/3. As an example of
their use, for detail category 160 (plates and flats with as-rolled edges, with
sharp edges, surface and rolling flaws removed by grinding until a smooth
transition is achieved;
ΔσC = 160 MPa – see Table 8.1 of EC3-1-9), the endurance for a nominal direct
stress range of 250 MPa is given by:
3 × log10250 + log10NR = 3 × log10160 +log102 × 106
NR = 5.243 × 10⁵
ie the endurance at a constant amplitude stress range of 250 MPa is about
524,000 cycles.
Fatigue loading
Fatigue loading usually involves a spectrum of loads of different magnitudes.
A spectrum can be built up for a particular structural action which can then be
converted into a stress history.
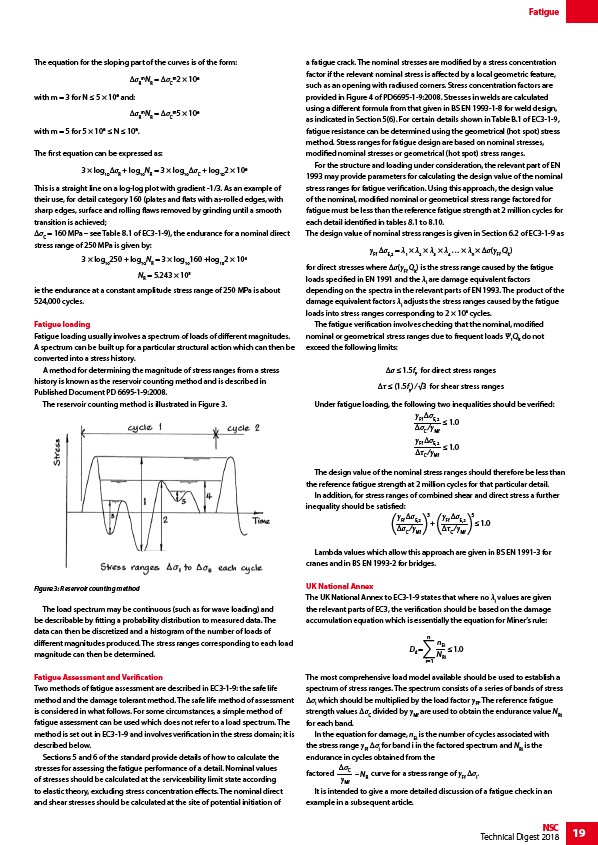
A method for determining the magnitude of stress ranges from a stress
history is known as the reservoir counting method and is described in
Published Document PD 6695-1-9:2008.
The reservoir counting method is illustrated in Figure 3.
The load spectrum may be continuous (such as for wave loading) and
be describable by fitting a probability distribution to measured data. The
data can then be discretized and a histogram of the number of loads of
different magnitudes produced. The stress ranges corresponding to each load
magnitude can then be determined.
Fatigue Assessment and Verification
Two methods of fatigue assessment are described in EC3-1-9: the safe life
method and the damage tolerant method. The safe life method of assessment
is considered in what follows. For some circumstances, a simple method of
fatigue assessment can be used which does not refer to a load spectrum. The
method is set out in EC3-1-9 and involves verification in the stress domain; it is
described below.
Sections 5 and 6 of the standard provide details of how to calculate the
stresses for assessing the fatigue performance of a detail. Nominal values
of stresses should be calculated at the serviceability limit state according
to elastic theory, excluding stress concentration effects. The nominal direct
and shear stresses should be calculated at the site of potential initiation of
a fatigue crack. The nominal stresses are modified by a stress concentration
factor if the relevant nominal stress is affected by a local geometric feature,
such as an opening with radiused corners. Stress concentration factors are
provided in Figure 4 of PD6695-1-9:2008. Stresses in welds are calculated
using a different formula from that given in BS EN 1993-1-8 for weld design,
as indicated in Section 5(6). For certain details shown in Table B.1 of EC3-1-9,
fatigue resistance can be determined using the geometrical (hot spot) stress
method. Stress ranges for fatigue design are based on nominal stresses,
modified nominal stresses or geometrical (hot spot) stress ranges.
For the structure and loading under consideration, the relevant part of EN
1993 may provide parameters for calculating the design value of the nominal
stress ranges for fatigue verification. Using this approach, the design value
of the nominal, modified nominal or geometrical stress range factored for
fatigue must be less than the reference fatigue strength at 2 million cycles for
each detail identified in tables 8.1 to 8.10.
The design value of nominal stress ranges is given in Section 6.2 of EC3-1-9 as
γFf ΔσE,2 = λ1 × λ2 × λ3 × λ4 … × λn × Δσ(γFf Qk)
for direct stresses where Δσ(γFf Qk) is the stress range caused by the fatigue
loads specified in EN 1991 and the λi are damage equivalent factors
depending on the spectra in the relevant parts of EN 1993. The product of the
damage equivalent factors λi adjusts the stress ranges caused by the fatigue
loads into stress ranges corresponding to 2 × 10⁶ cycles.
The fatigue verification involves checking that the nominal, modified
nominal or geometrical stress ranges due to frequent loads Ψ1Qk do not
exceed the following limits:
Δσ ≤ 1.5fy for direct stress ranges
Δτ ≤ (1.5fy) ⁄ √3 for shear stress ranges
Under fatigue loading, the following two inequalities should be verified:
1.0
Ff E,2
C /Mf
1.0
Ff E,2
C /Mf
The design value of the nominal stress ranges should therefore be less than
the reference fatigue strength at 2 million cycles for that particular detail.
In addition, for stress ranges of combined shear and direct stress a further
inequality should be satisfied:
( ) 3 Ff E,2
( Ff E,2
) 5
//C Mf
C Mf 1.0
+
Lambda values which allow this approach are given in BS EN 1991-3 for
cranes and in BS EN 1993-2 for bridges.
UK National Annex
The UK National Annex to EC3-1-9 states that where no λi values are given
the relevant parts of EC3, the verification should be based on the damage
accumulation equation which is essentially the equation for Miner’s rule:
1.0
n
nEi
NRi i=1
Dd =
The most comprehensive load model available should be used to establish a
spectrum of stress ranges. The spectrum consists of a series of bands of stress
Δσi which should be multiplied by the load factor γFf. The reference fatigue
strength values ΔσC divided by γMf are used to obtain the endurance value NRi
for each band.
In the equation for damage, nEi is the number of cycles associated with
the stress range γFf Δσi for band i in the factored spectrum and NRi is the
endurance in cycles obtained from the
factored – NR
C
Mf
curve for a stress range of γFf Δσi.
It is intended to give a more detailed discussion of a fatigue check in an
example in a subsequent article.
Figure 3: Reservoir counting method